





Why does a 100g portion of cooked eel show more protein per gram than raw eel — did the fish suddenly get healthier when it hit the grill? No. It didn't gain nutrients. It lost water. This single mix-up trips up buyers, product developers, and even nutrition label writers more than any other question about nutrition eel data. Get the moisture math wrong, and your spec sheet, your menu claim, or your import documentation can end up misleading a customer without anyone intending it.
This matters more than it sounds. Foodservice buyers comparing frozen unagi kabayaki against raw fillet quotes need to know they're comparing the same fish, not different water content. Let's break down what's real and what's just moisture leaving the tissue.
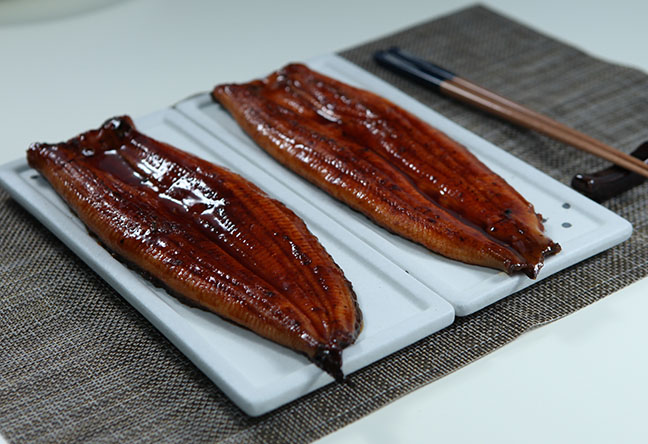
Eel meat starts around 60-65% moisture by weight in the raw state. Roasting, grilling, or kabayaki-style glazing drives off water — sometimes 15-20% of the original weight is gone by the time the eel is done. That means a 100g raw portion might shrink to 80-85g cooked. If you then measure "protein per 100g" on the cooked side, you're weighing a more concentrated product, not necessarily a more nutritious one gram-for-gram of original fish.
This is the same reporting trap that confuses buyers comparing dried versus fresh frozen seafood products. The fix is simple: always ask whether a nutrition table is normalized to original raw weight or reported on an as-cooked basis. Both are valid — but they answer different questions.
Below is a normalized comparison. The "as-cooked" column reflects standard measured values after roasting (kabayaki-style, sauce-glazed). The "moisture-adjusted" column recalculates cooked nutrients back to a same-weight-as-raw basis, isolating what actually changed versus what's just concentration from water loss.
| Parameter | Raw Eel (100g) | Cooked Eel, As Served (100g) | Cooked Eel, Moisture-Adjusted to Raw Weight |
|---|---|---|---|
| Moisture content | ~62% | ~48-52% | n/a — this is the variable being controlled for |
| Protein | ~17g | ~19-20g | ~17.5-18g (small real increase from fat rendering, not moisture) |
| Total fat | ~13-16g | ~14-19g (glaze-dependent) | ~13-15g (roughly flat; roasting renders some subcutaneous fat out) |
| Calories | ~185-200 kcal | ~230-290 kcal (sauce adds sugar/calories) | ~190-210 kcal (most of the increase is the tare glaze, not the fish) |
The takeaway: most of the "protein boost" you see on a cooked eel label is moisture loss, not new protein. The real, moisture-adjusted change is small — a few percentage points from fat rendering during roasting. Fat content stays close to flat once you strip out water effects, and the calorie jump you often see with kabayaki-style products comes mainly from the soy-based tare glaze, not the eel itself. If a supplier's spec sheet shows a dramatic protein jump between raw and cooked without mentioning moisture basis, ask which basis they used — it's a fair, common question in export documentation.
If you're comparing suppliers or deciding between raw fillet and pre-roasted kabayaki for a menu, the moisture-adjustment matters practically, not just academically.
Limit to keep in mind: moisture-adjusted figures are a calculation, not a direct lab measurement of the cooked product. They're useful for apples-to-apples comparison, not for a printed nutrition panel on packaging — regulators expect as-served values on that.
Say you're a foodservice buyer sourcing for an Asian-fusion chain in Australia or Southeast Asia. Supplier A quotes raw fillet at 17g protein/100g. Supplier B quotes finished kabayaki at 20g protein/100g and markets it as "higher protein eel." On paper, B looks better.
Step through it:
Real difference between the two suppliers, once normalized, might be under 5% — not the 18% the raw label comparison implied. That's the kind of gap that changes a sourcing decision, or doesn't, depending on your actual margin needs.
Farming traceability plays into this too. Nutrition consistency starts upstream — raw material variability between farms shows up later as inconsistent fat and protein readings across lots. Full-chain traceability from certified eel farming bases through to shipment is one of the more reliable ways buyers confirm a supplier isn't blending unverified lots.
Not all "cooked eel" is cooked the same way, and that affects the numbers more than people expect.
For teams building menu items or retail packaging around unagi kabayaki eel, this distinction is worth documenting once and reusing — it saves re-litigating the same nutrition question every time a new SKU launches. Recipe developers exploring different preparations can also see how glaze ratios shift flavor and finish in a practical write-up on kabayaki sauce balance.
Any nutrition figure is only as trustworthy as the testing behind it. Standardized nutrient testing generally follows methods referenced by bodies like the U.S. Food and Drug Administration for proximate analysis — moisture, protein (nitrogen-based), fat, and ash. Buyers evaluating export documentation should expect test reports referencing comparable methodology, not just marketing-rounded numbers. Facilities running in-house testing — including metal detection at critical control points and dedicated lab staff — tend to produce more consistent lot-to-lot data, which is what actually protects a buyer's menu claims downstream.
If you're evaluating raw fillet versus finished kabayaki for a new product line, request our current spec sheet and lab test summary — it's an easy way to confirm the moisture basis before you commit to a quote.

 WhatsApp
 sales@chinaeels.com
 +8619937922411