





A menu planner pulls a raw-eel spec sheet from one supplier and a grilled kabayaki nutrition label from another. The numbers don't match — and neither is wrong. Understanding the nutrition of eel requires separating raw weight from cooked weight, because roasting concentrates calories, protein, and fat per gram even though the fish itself hasn't gained anything. This matters for menu labeling, cost-per-plate math, and regulatory accuracy in Japan, the US, and the EU, where calorie disclosure rules apply to the served item, not the raw purchase weight.
Eel loses moisture during roasting — typically in the range of 20-30% of raw weight, depending on fat content, roasting time, and whether the piece is skin-on or boneless. Water leaves, but protein, fat, and calories stay in the flesh. The result: cooked eel shows a higher nutrient density per 100g than raw eel, even though no nutrients were added.
This is standard food-science behavior, not a defect. According to USDA FoodData Central reference values, raw freshwater eel runs close to 184 kcal per 100g, while eel cooked by dry heat runs closer to 236 kcal per 100g. The same shift applies to protein and fat. If a buyer applies raw-eel numbers to a grilled kabayaki portion, the menu underreports calories and protein. If a buyer applies grilled per-100g values to the raw purchase weight, the total overstates what's actually on the plate.
The table below shows how the same 100g of eel changes on paper once it's roasted. Use this as your baseline before applying it to actual purchase weights.
| Nutrient (per 100g) | Raw Eel | Grilled / Kabayaki Eel | What Changes and Why |
|---|---|---|---|
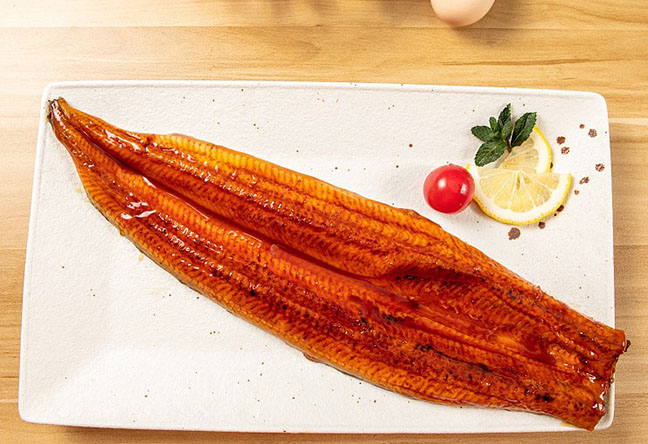
| Calories | ~184 kcal | ~236 kcal | Moisture loss concentrates energy density; no calories are added unless sauce is applied. |
| Protein | ~18.4 g | ~23.7 g | Protein isn't lost during roasting — it becomes more concentrated per gram as water evaporates. |
| Fat | ~11.7 g | ~15.1 g | Some subcutaneous fat renders out, but remaining fat concentrates faster than it's lost. |
| Approx. moisture loss | — | 20-30% | Directly drives the calorie and protein "increase" seen on cooked labels. |
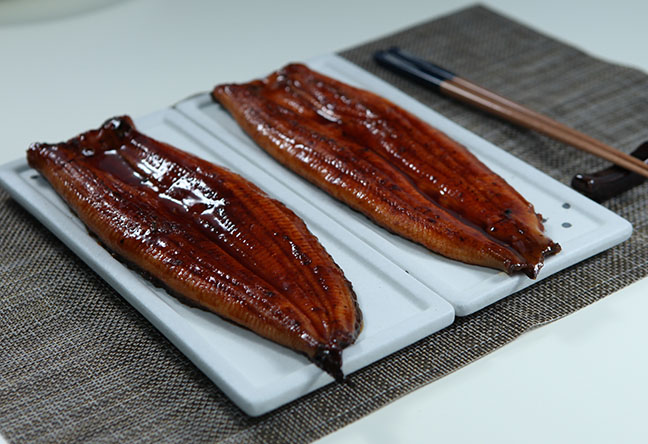
What this actually affects: if your kitchen buys 150g of raw eel fillet and it roasts down to roughly 110-115g of finished kabayaki, the total calorie count in that piece stays close to the raw total — but the per-gram density on the plate is now higher. A menu that lists "236 kcal per 100g serving" is technically accurate only if the plated portion is actually weighed after cooking, not estimated from the raw purchase spec. Get this backwards and you either underfeed your calorie disclosure or inflate it — both create compliance headaches in labeling-strict markets like the US and EU.
Different cutting specifications change how consistent your nutrition numbers stay from batch to batch. This matters more than most menu teams expect, because a supplier that varies cut thickness will hand you a moving target every reorder.
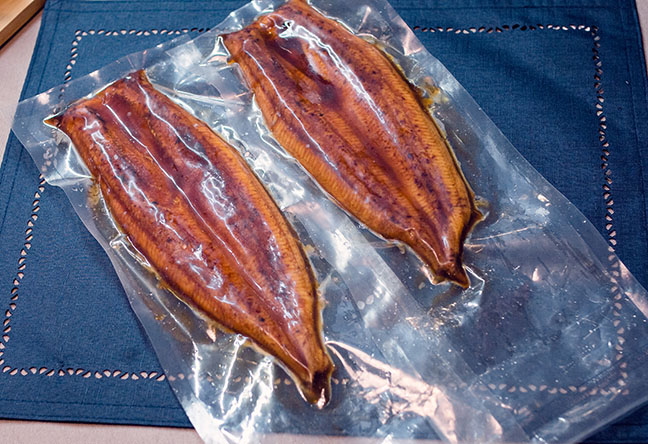
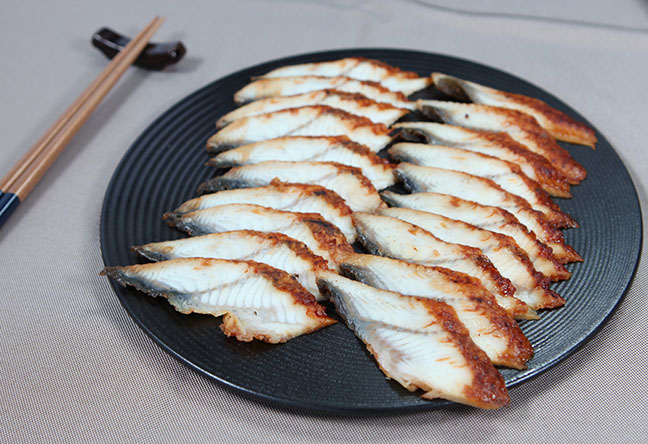
If your operation needs standardized cutting for repeatable nutrition labeling, custom specs — shredding, dicing, strip-cutting, 3-section cut, or sushi slice — reduce back-of-house guesswork. This is one reason foodservice buyers increasingly source frozen unagi kabayaki pre-cut to spec rather than trimming whole eels on-site, where cut variance is harder to control.
Say a kitchen orders eel portioned at 150g raw per serving. After roasting, the piece finishes at approximately 112g (a 25% moisture loss, mid-range for kabayaki). Using cooked-eel values: 112g × 2.36 kcal/g ≈ 264 kcal from the eel alone. Add roughly 35-45 kcal for a standard tare glaze, and the dish lands near 300-310 kcal before rice. That's the number that belongs on a nutrition label — not the 276 kcal you'd get by simply scaling the raw-weight figure, and not the 355 kcal you'd get by mistakenly applying cooked-per-100g values to the original 150g raw purchase weight.
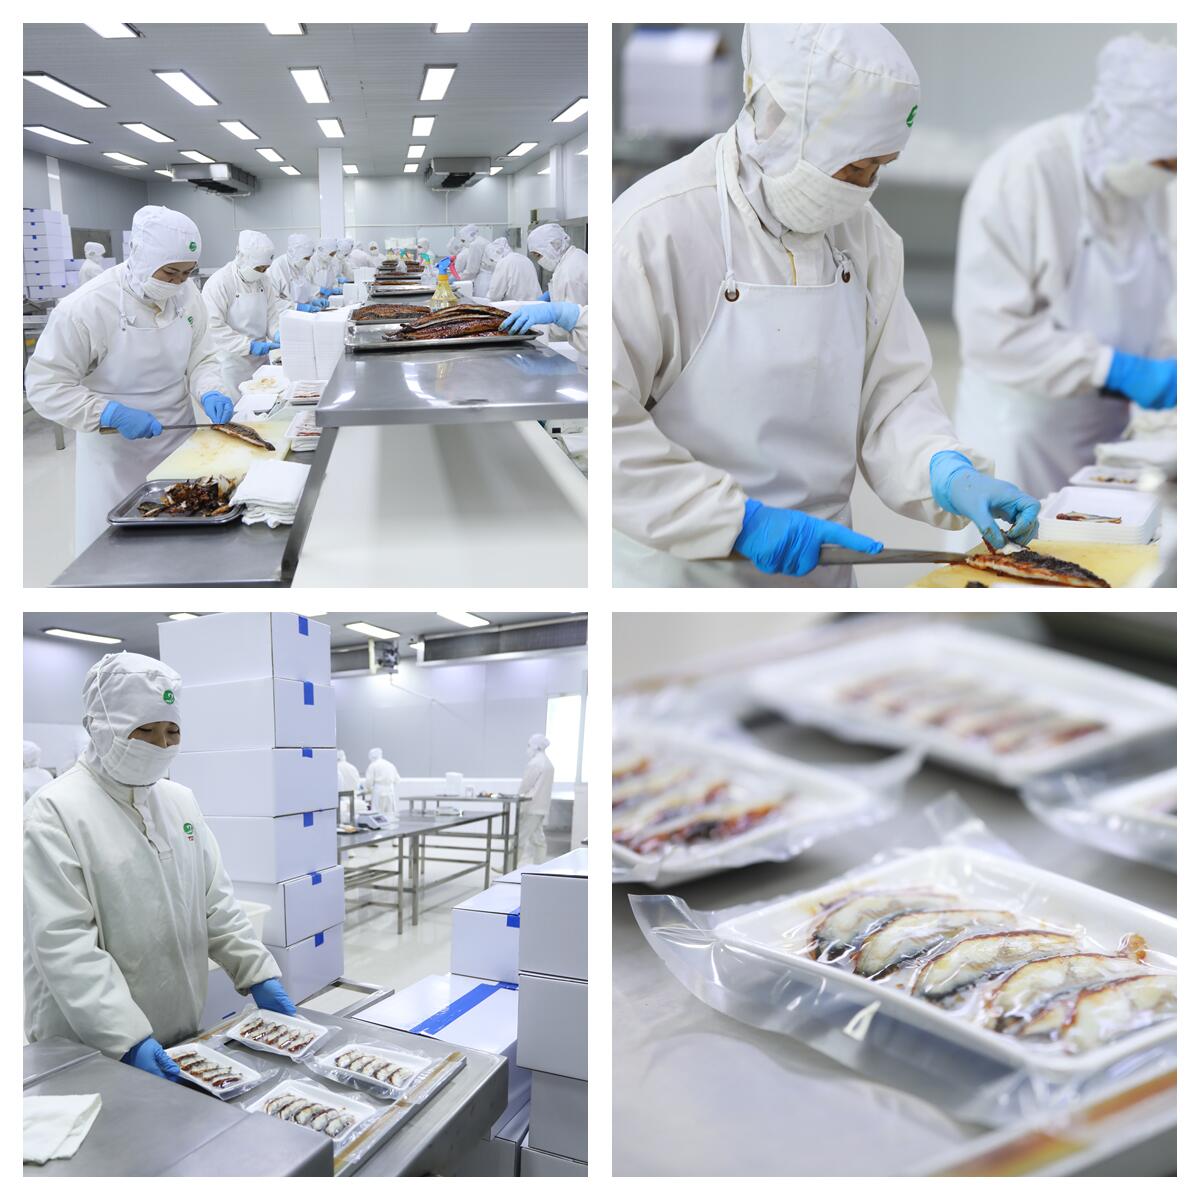
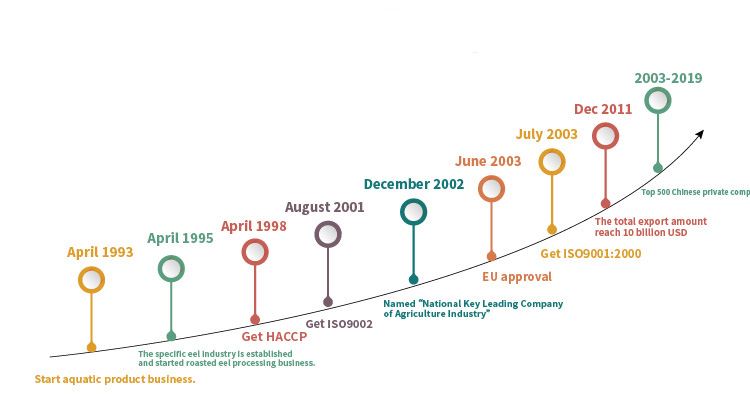
On that last point, traceability isn't a formality — it's what lets a buyer confirm nutrition and safety claims after the fact. Full-chain tracking from eel farming bases through processing and shipment, backed by an in-house laboratory and metal detection at critical control points, is what makes a stated nutrition figure defensible rather than just printed.
Roasting technique itself shifts fat content, separate from moisture loss. A four-layer soy-sauce coating process with temperature-controlled steps renders surface fat differently than a single-pass grill. Low-fat roasting methods — including patented deodorizing and fat-reduction techniques used in export-grade processing — can lower the finished fat percentage compared to conventional home-style grilling, which matters if a menu is marketing a "lighter" eel dish. Buyers evaluating a frozen eel supplier for nutrition-sensitive menu lines should ask specifically how the roasting process handles fat rendering, not just what the final calorie count is.
For teams building recipes around these numbers, it also helps to see how eel behaves across preparation styles — from cleaning, skinning and deboning through final plating — since trim method changes both usable yield and the fat-to-protein ratio in the final serving.
If you're finalizing a menu or nutrition label and need verified raw-versus-cooked figures for a specific cut or pack format, request a spec sheet from our quality team — we can confirm the numbers against your exact product format before you print anything.
 WhatsApp
 sales@chinaeels.com
 +8619937922411