





Eel nutrition is the set of measurable values — calories, protein, fat, sodium, and key vitamins — that describe what's actually in a portion of eel once it's cooked and plated. For a home cook, that's trivia. For a restaurant buyer or distributor, it's a compliance issue and a menu-accuracy issue at the same time. Get the numbers wrong on a printed menu or a nutrition disclosure sheet, and you're looking at customer complaints, health-department questions, or worse. This matters more with eel than with most seafood, because unagi kabayaki comes glazed in a sauce that changes the sodium and sugar count significantly compared to plain grilled eel.
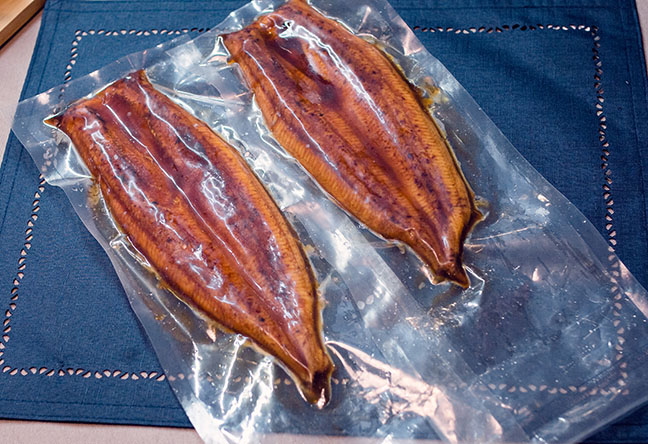
I've worked with distributors who assumed frozen unagi kabayaki carries the same nutrient profile as raw freshwater eel. It doesn't. Once you factor in the tare glaze, the numbers shift enough to matter on a label. This guide walks through exactly how to document eel nutrition for commercial menus, spec sheets, and nutrition disclosures — with real serving-size math, not just a summary chart to skim.
A baseline eel nutrient profile, based on USDA-style raw freshwater eel data (per 100g), looks roughly like this:
| Nutrient | Per 100g Raw Eel | Per 100g Kabayaki (glazed, cooked) |
|---|---|---|
| Calories | ~184 kcal | ~285 kcal |
| Protein | ~18.4g | ~23g |
| Total Fat | ~11.7g | ~19.5g |
| Sodium | ~51mg | ~700-900mg (sauce-dependent) |
| Vitamin A | ~1,050mcg RAE | Retained, slightly reduced by cooking |
| Vitamin B12 | ~3.5mcg | Retained through grilling |
| Omega-3 (DHA+EPA) | ~1.5g | ~1.2-1.4g (some loss from grilling) |
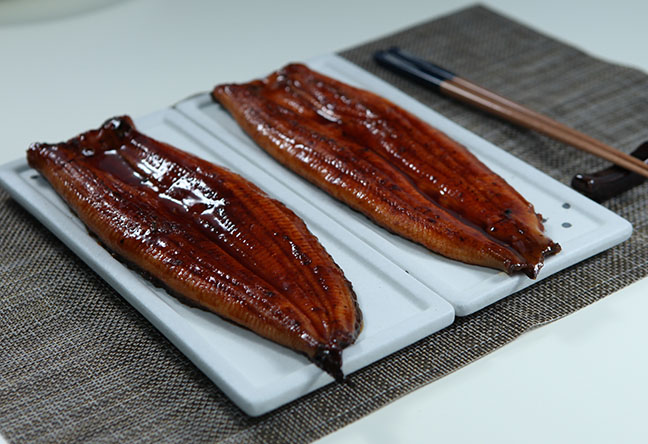
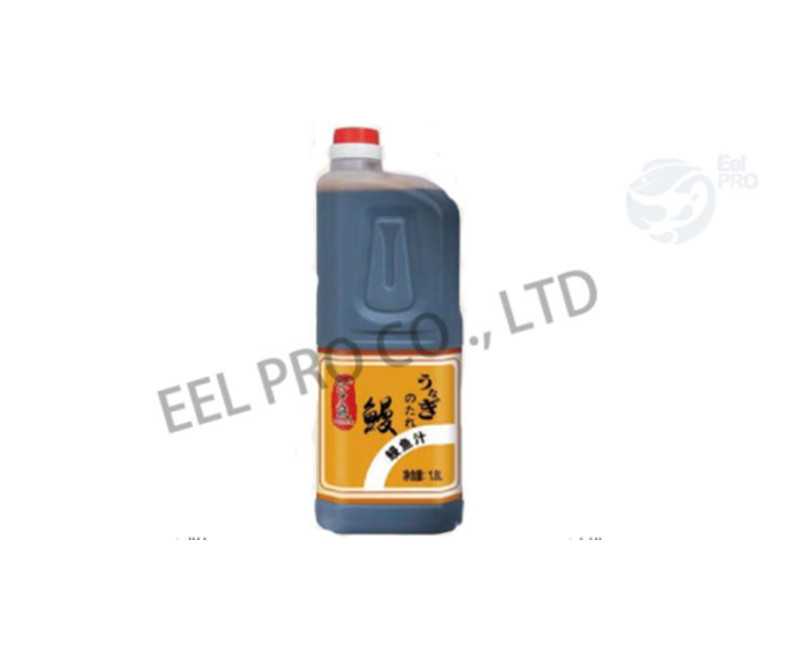
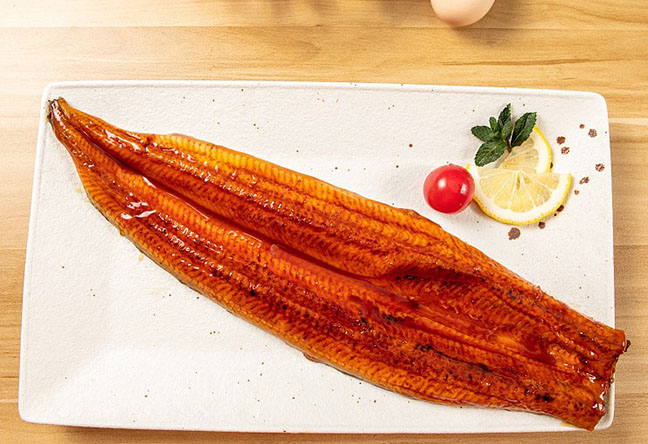
Notice the sodium jump. That's the tare — the sweet soy glaze brushed on repeatedly during grilling. If your restaurant sources eel sauce separately and applies it in-house, your sodium and sugar figures depend entirely on how much glaze goes on and how many times it's brushed during grilling. This is the detail most menu labeling errors trace back to.
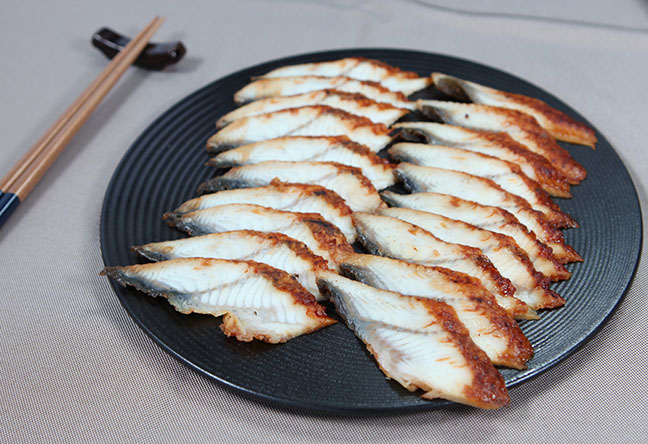
Unagi nutrition facts shift dramatically depending on what "one serving" means in your kitchen. A sushi bar slicing eel into 15g nigiri toppings has a completely different label than a donburi restaurant serving a 150g grilled fillet over rice.
This is exactly why generic "eel nutrition per serving" numbers pulled from a database are risky to print as-is. You have to recalculate for your actual plated portion, not the raw 100g reference. If you want cooking-format ideas that also help you standardize portions, our eel recipes page and the unagi ramen: japanese eel noodle soup guide both show typical serving weights used in commercial kitchens.
This is the single biggest factor affecting eel nutritional value on your menu, and it's worth its own section because most buyers never compare the two paths side by side.
| Factor | Frozen Pre-Glazed Kabayaki | Raw Eel + In-House Tare |
|---|---|---|
| Nutrient consistency | Fixed — same glaze ratio every batch | Variable — depends on chef's brushing technique |
| Sodium predictability | High — supplier spec sheet gives one number | Low — must be tested per batch |
| Labeling effort | Low — use supplier nutrition data directly | High — requires in-house lab testing or recipe calculation |
| Menu compliance risk | Lower | Higher, especially for multi-location chains |
| Flavor customization | Limited to supplier's recipe | Full control over sweetness/saltiness |
For operators running more than one location, pre-glazed frozen unagi kabayaki removes most of the guesswork — the nutrient values on the spec sheet apply consistently across every plate you serve, no batch-to-batch drift. If your team prefers making sauce in-house for flavor control, our breakdown on kabayaki sauce explains how the glaze ratio affects both taste and nutrient load, and the kabayaki sauce recipe: fix flavor mistakes page covers common sodium-related mistakes kitchens make when adjusting the glaze.
At minimum, a defensible eel menu labeling disclosure should include:
Some operators also add Vitamin A and Vitamin B12 as marketing points, since eel's nutrient profile is genuinely strong here compared to most freshwater fish. Just make sure these are backed by lab data or a supplier's certificate, not database estimates alone — that's where accuracy disputes usually start.
If you're sourcing eel and want traceability behind the numbers, our eel farm and eel lab pages describe how Eelpro documents raw material quality before it reaches the kabayaki production line — useful background if a health inspector asks where your nutrient data originated.
Start with your supplier's certified nutrition data for the specific product form (raw, kabayaki, sauced), then weigh your actual cooked and plated portion three separate times to get an average. Adjust for cooking loss (roughly 15-20% weight reduction from grilling), add sauce contribution if applied separately, and round according to your local labeling authority's rules before publishing.
At minimum: calories, total fat, saturated fat, cholesterol, sodium, total sugars, and protein. Given eel's naturally strong Vitamin A and B12 content, many operators list these as well, provided the values come from lab testing or a supplier certificate rather than a generic database estimate.
Significantly. A 15-20g nigiri topping runs about 45-55 kcal, while a 150g donburi portion runs closer to 425 kcal, with sodium scaling from roughly 130mg to over 1,000mg depending on glaze quantity. Never assume linear scaling without checking sauce application per portion size — heavier glazing on larger portions can push sodium up faster than calories.
Properly frozen eel retains its core nutrient profile — protein, fat, and vitamin content stay stable when stored and thawed correctly. The bigger variable for label accuracy is the glaze application at cooking time, not the freezing process itself.
Menu labeling accuracy isn't a one-time task — it's a recurring check every time your frozen seafood supplier adjusts a recipe or you switch grilling methods in the kitchen. Keep your spec sheets current, weigh your actual portions, and treat the tare glaze as its own nutrient variable rather than an afterthought. If you're refining your kabayaki technique alongside your labeling process, our guide on how to cook eel: cleaning, skinning & deboning guide is worth a look, and feel free to share your own menu labeling questions or portion-testing results in the comments below.
 WhatsApp
 sales@chinaeels.com
 +8619937922411